Why The Southern Flounder Numbers Always Change
Last week I showed you how every time the southern flounder stock in North Carolina was assessed the recreational data changed. This week I want to go into a little more detail and look at why the recreational data keeps changing and why it will probably change again.
2005 NC Southern Flounder FMP
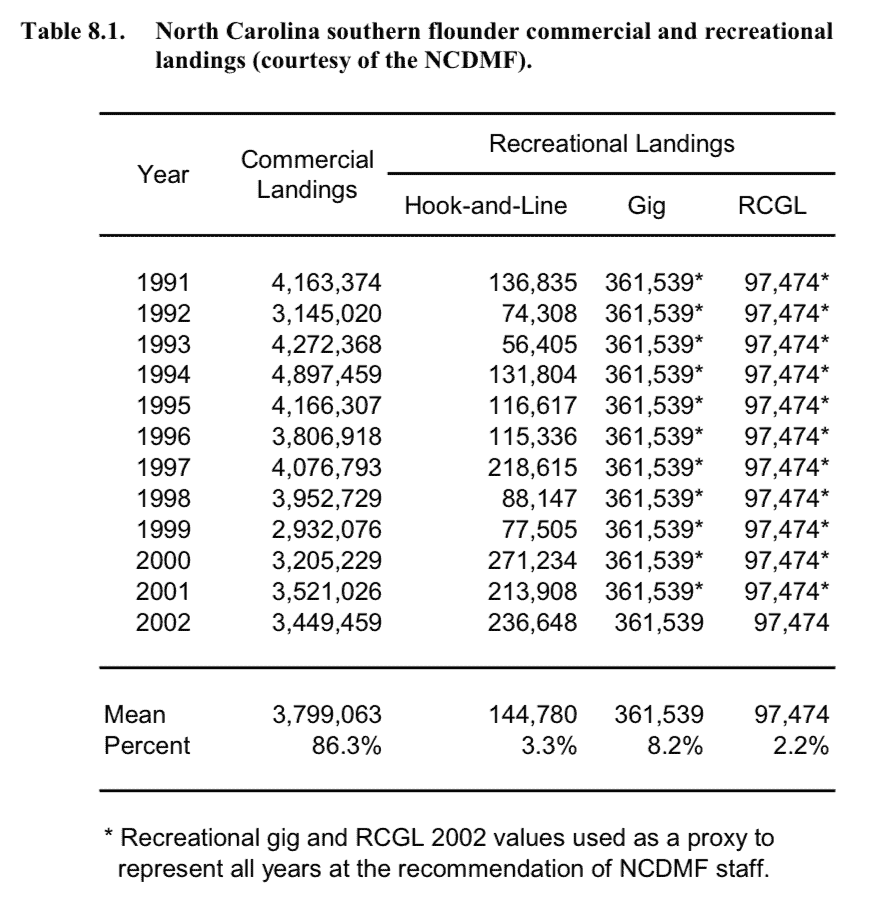
The first southern flounder fishery management plan (FMP) was completed in 2005 and gave us our first set of NC recreational harvest numbers for management. In the original 2005 FMP recreational landings were broken down into hook-and-line, gig, and recreational commercial gear license (RCGL). Each mode of recreational harvest was assessed and estimated separately.
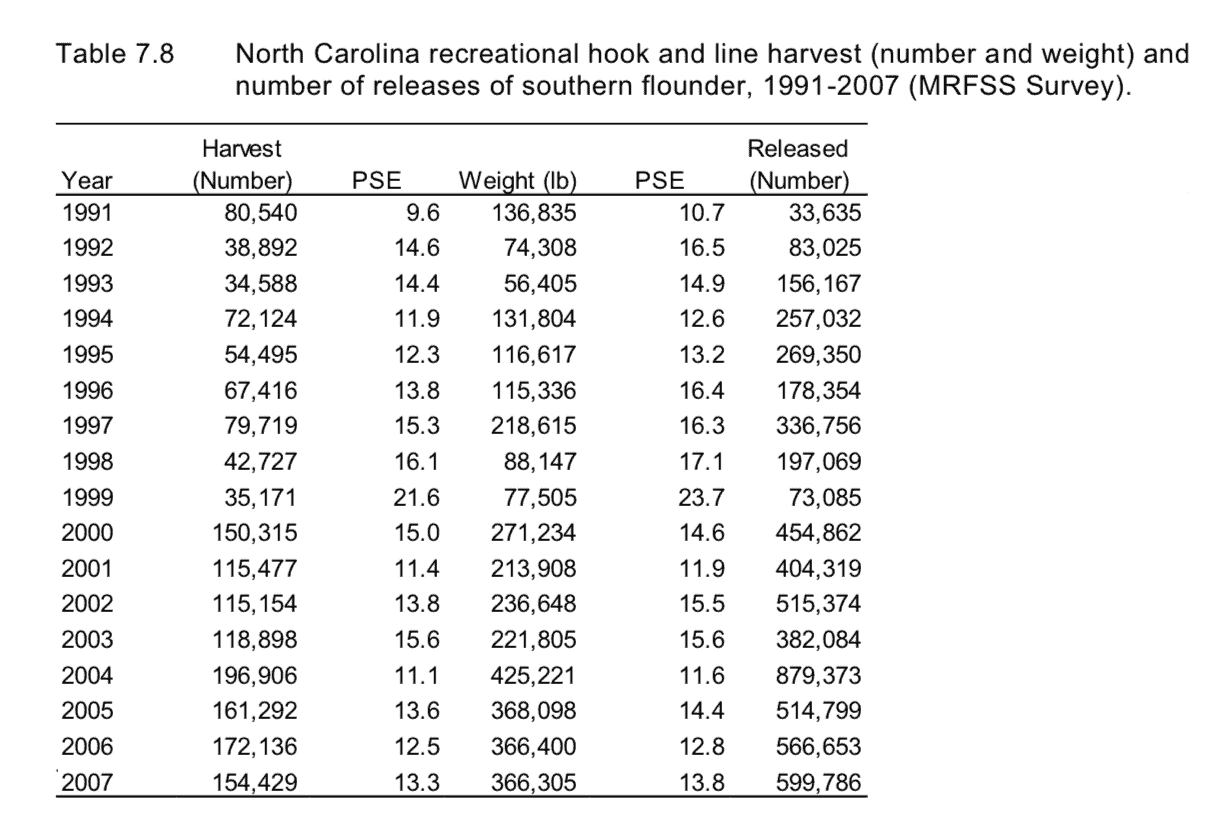
The hook-and-line recreational data was collected by the National Marine Fisheries Service (NMFS) through the Marine Recreational Fisheries Statistics Survey (MRFSS). According to the 2005 southern flounder FMP, MRFSS was not designed to provide reliable catch statistics for fisheries management at the state level so the North Carolina Division of Marine Fisheries (NCDMF) increased interviews of anglers up to 20,000 per year. MRFSS used telephone interviews to collect information on the number of trips and on-site angler interviews to collect information on actual catch. This data is then combined to produce estimates for total number and pounds of flounder caught recreationally with hook-and-line.
The recreational gig data was collected in a survey described in “Assessment of the gig fishery in North Carolina” by J. C. Watterson 2003. This survey consisted of a pilot study and a primary study which utilized an airplane to locate and count giggers twice a week and interviewers who surveyed giggers after completing their trip. The data from this survey was used to estimate a recreational gig harvest of 361,539 pounds in 2002. This number was used as a proxy for all previous years in the 2005 FMP.
Recreational commercial gear license (RCGL) data similarly only had one year of data available and the 2002 estimated RCGL landings of 97,474 pounds was used as a proxy for all other previous years.
Below is a table from the 2005 NC southern flounder FMP that summarizes this information.

2013 Amendment 1 to the NC Southern Flounder FMP
In 2013, the first amendment to the southern flounder FMP also looked at recreational hook-and-line, gig, and RCGL landings. The MRFSS program was again used to estimate the number of pounds harvested recreationally by hook-and-line and the numbers remained the same as they were in the original 2005 FMP (table below from the 2013 NC Southern Flounder FMP Amendment 1).

Amendment 1 overall recreational harvest numbers begin to change once we start looking at the recreational estimates of gig harvest. It says in Amendment 1 that, “the 2002 recreational southern flounder gig harvest estimates and the 2002 MRFSS southern flounder hook-and-line harvest estimate were similar so the 2009 southern flounder stock assessment assumed the annual recreational gig harvest was equal the annual recreational hook-and-line harvest for the entire time series covered in the stock assessment.”
But if you look at the first table in this weekly update you can clearly see that recreational gig harvest and recreational hook-and-line harvest in 2002 was in fact NOT similar. In fact, gig harvest in 2002 was shown to be over 50% higher than hook-and-line harvest in the original FMP. So, to figure out why/how this gig harvest number changed I reviewed the 2009 southern flounder stock assessment that was used for Amendment 1.
The 2009 stock assessment says that the original estimate for recreational gig harvest included samples from commercial giggers and likely overestimated recreational harvest. So, this time, they decided to only use southeastern NC gig data and once commercial catches were removed from analysis, recreational gig harvests in 2002 were estimated between 189,926 to 218,008 pounds.
I could not understand how a 2-1/2 year study could have over calculated recreational gig harvest by 40% so I looked into the Assessment of the Gig Fishery for Southern Flounder in North Carolina (Watterson 2003). This assessment told a different story of the gig harvest estimates.
This assessment focused on the southeastern part of North Carolina but the study also extrapolated the harvest statewide and estimated that 441,005 pounds of southern flounder were harvested by gigs in 2002. The study then subtracted approximately 80,000 pounds of annually reported commercial gig harvest to give us the 361,539 pound of recreational gig harvest that we saw in the original FMP. Why the 2009 stock assessment disregarded this statewide estimate and only included recalculated estimates from the southeastern survey area is unknown to me.
Recreational Commercial Gear License (RCGL) landings were not used in Amendment 1 recreational harvest estimates. The amendment says, “Reliable RCGL harvest estimates prior to 2002 were unavailable because of considerable changes in the behavior of RCGL fishermen over the years. Because reliable RCGL harvest estimates were unavailable for the entire time series and because RCGL harvest of southern flounder was minimal compared to the total annual harvest, RCGL harvest was not included”.
2019 Amendment 2 to the Southern Flounder FMP
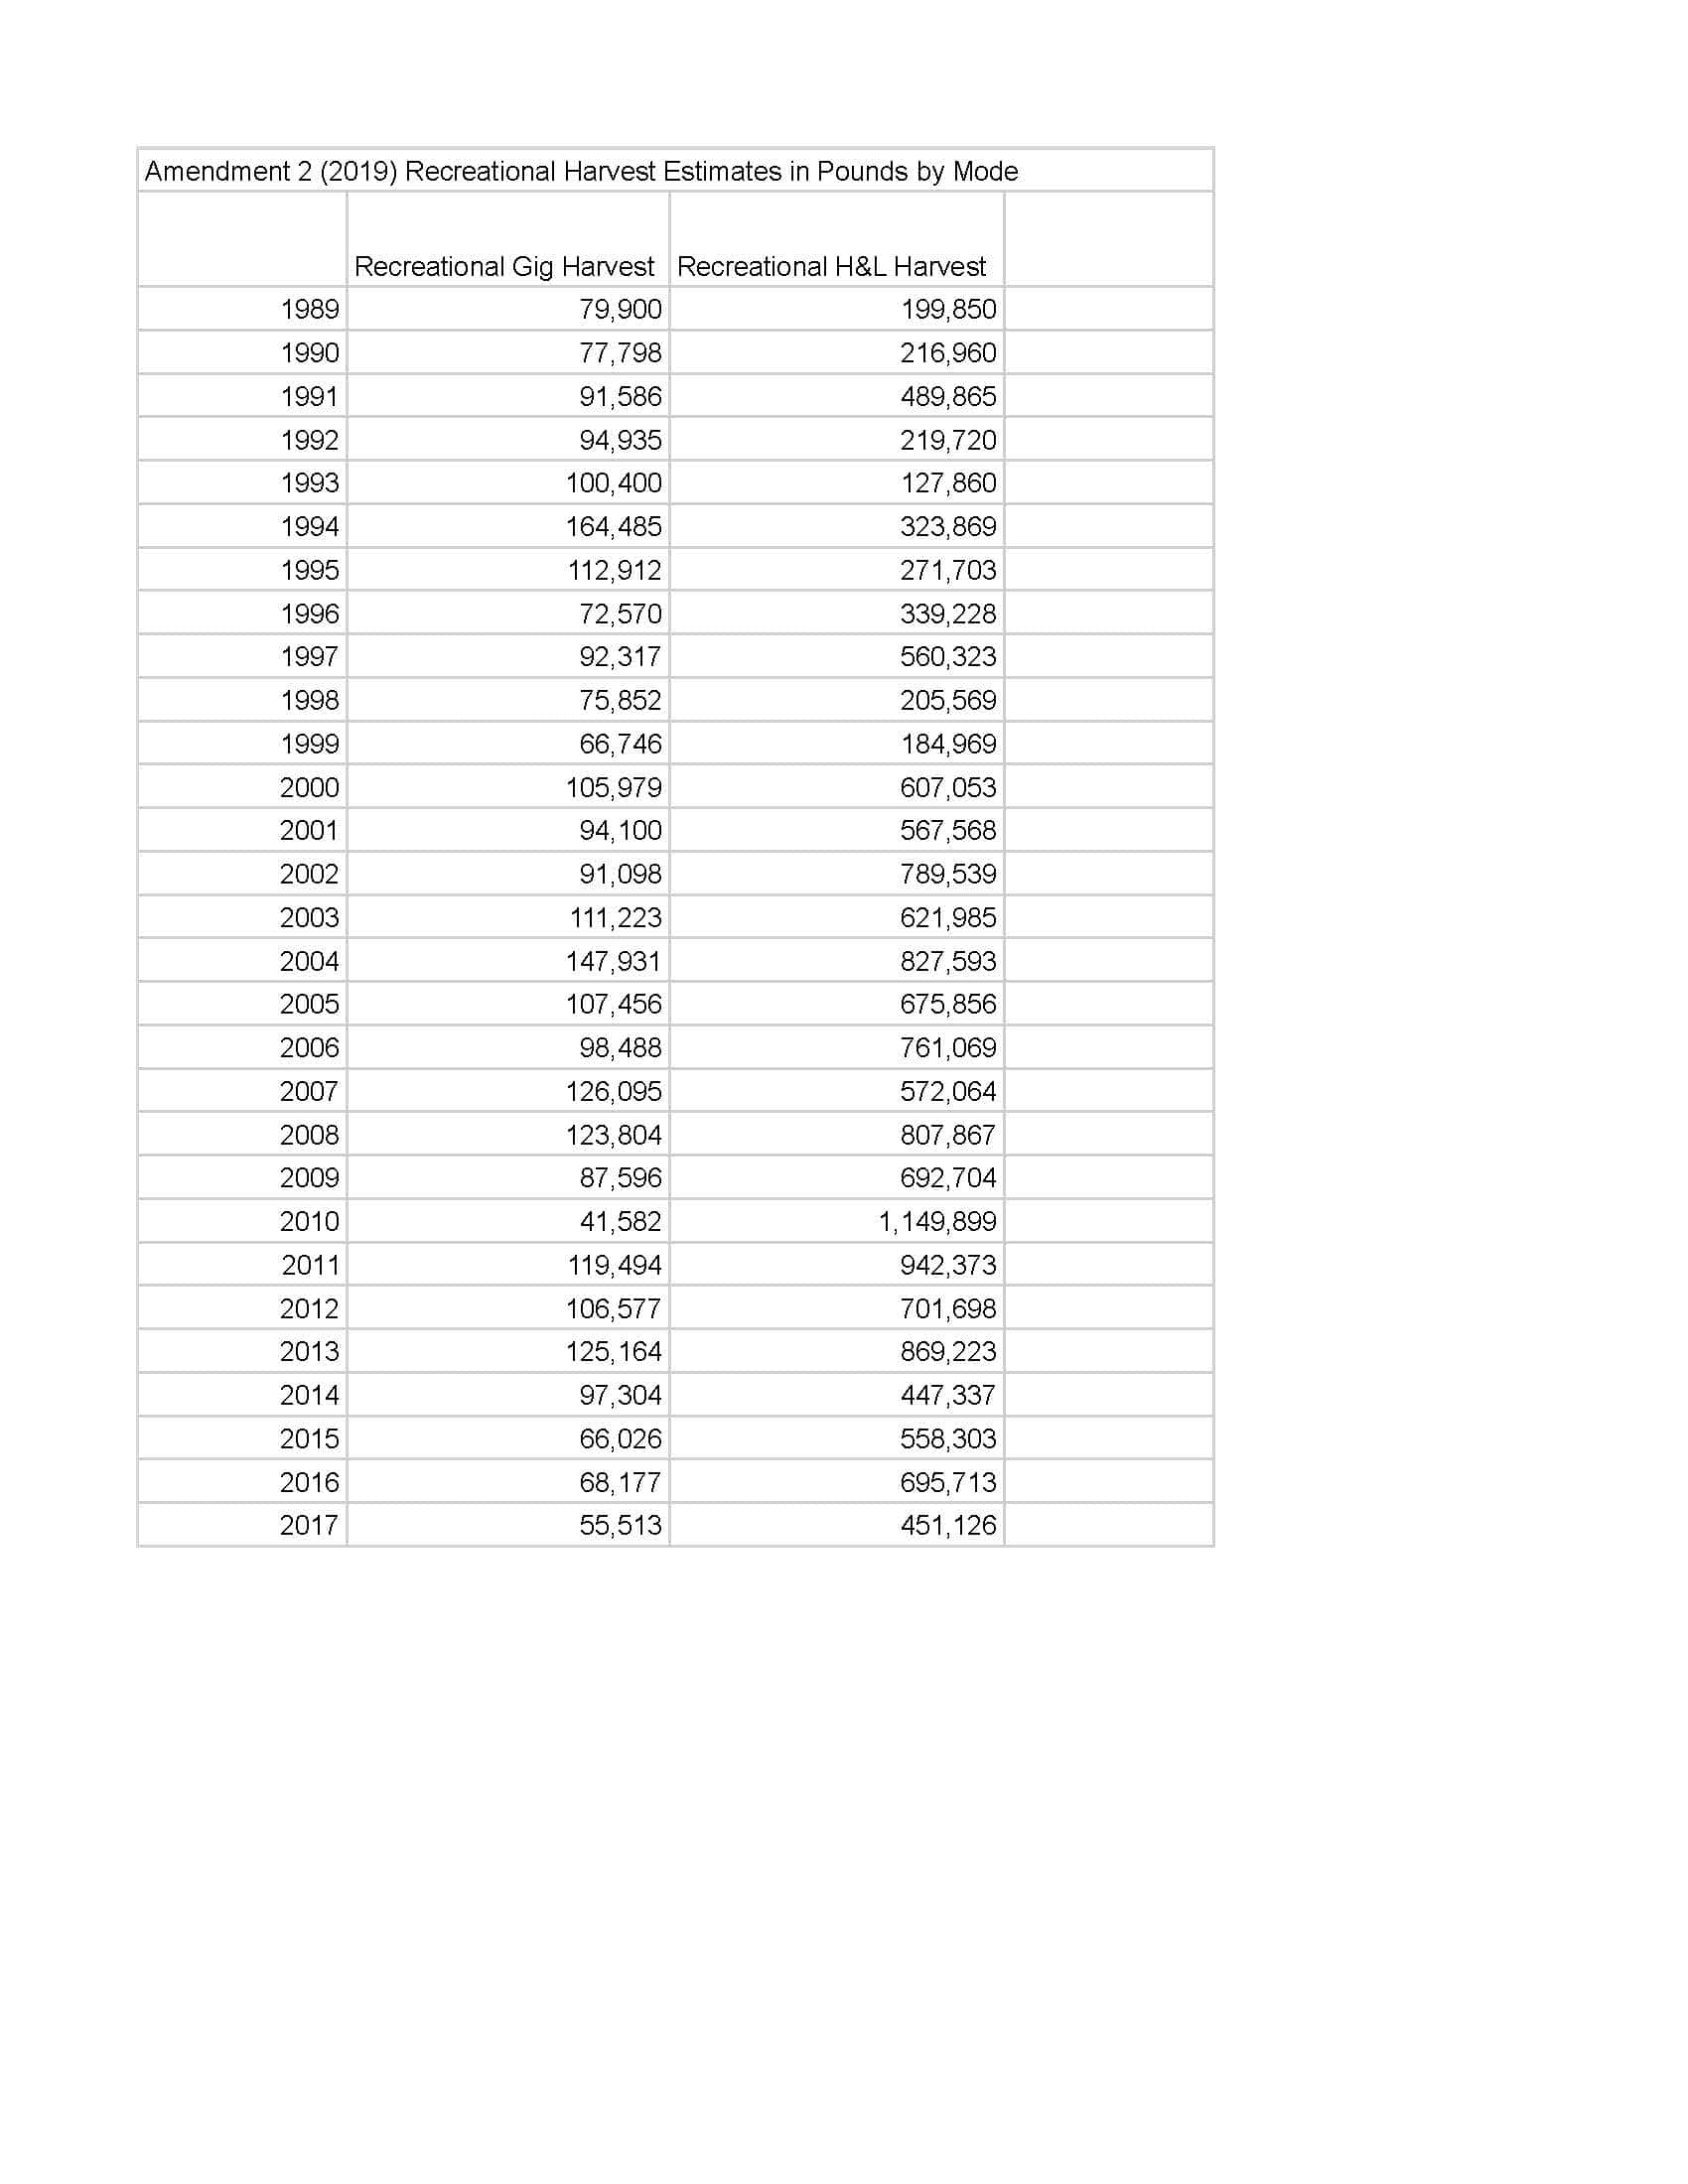
In Amendment 2 to the southern flounder FMP, we are now down to only two modes of recreational harvest; hook-and-line and gig (RCGL estimates were again decided not to be used for recreational harvest estimates).
In this amendment estimates of recreational hook-and-line harvest no longer used MRFSS. In this amendment we transitioned to the Marine Recreational Information Program (MRIP). For this stock assessment MRIP was using the telephone survey to estimate effort and an angler intercept survey to record catch and reported discards.
MRIP replaced MRFSS and began producing recreational hook-and-line harvest estimates in 2012. Amendment 2 also says, “Taking advantage of the new methodology, NOAA analysts produced new estimates of catch from 2004-2011 [and] for years prior to 2004, years for which the data do not allow application of the MRIP methodology, should be calibrated to the MRIP estimates using a ratio-of-means estimator.” This completely changed recreational hook-and-line harvest numbers and gave us two extra years of estimates (1989 and 1990).
Amendment 2 changed recreational gig harvest estimates once again. As far as I can tell the previous 2003 Assessment of the gig fishery in NC survey was completely disregarded for this amendment. In this amendment, estimates of recreational gig harvest was calculated using a mail survey from July 2010 to December 2015. According to the 2018 stock assessment, outliers from the survey were removed and an average of the estimated harvest ratios of gig to hook-

and-line harvests from 2010 to 2015 were used to back calculate gig harvest from 1989 to 2009. This significantly changed recreational gig harvest data for the third time.
Conclusion
Recreational fisheries estimates are just what they imply, estimates. Even though we are using the so-called best available science each time we calculate these estimates, they are still just estimates. How can we equitably manage a fishery with hard data coming from one sector while using estimates from the other? How can we trust that fisheries management is working if we keep changing baseline data?
I would also like to note that recreational data collection has already changed again since the last southern flounder stock assessment. We have now shifted from the telephone effort survey to the fishing effort survey (FES), which uses a mail survey to estimate effort. And on yet another note, in response to a recent pilot study indicating a problem with overestimating recreational effort, NOAA will be conducting a large-scale study in 2024 to see if the FES mail survey needs to be changed. So, we may very well see recreational hook-and-line estimates change for a fourth time!
These ever-changing recreational estimates exist in all of our fisheries.
Thomas Newman
Fisheries Liaison
